
Stock trades by members of Congress
Members of Congress must disclose stock trades by themselves, their spouses and dependent children. We read every periodic transaction report filed since January 3, 2015 (7,721 reports), match the trades to the companies we cover, and show how each stock moved afterwards.
Trades disclosed each week
Show as a table
| Week | Purchases | Sales |
|---|---|---|
| Week of May 11, 2026 | 8 | 12 |
| Week of May 18, 2026 | 13 | 38 |
| Week of May 25, 2026 | 10 | 8 |
| Week of June 1, 2026 | 52 | 57 |
| Week of June 8, 2026 | 73 | 56 |
| Week of June 15, 2026 | 6 | 19 |
| Week of June 22, 2026 | 6 | 5 |
| Week of June 29, 2026 | 45 | 23 |
| Week of July 6, 2026 | 30 | 36 |
| Week of July 13, 2026 | 26 | 49 |
| Week of July 20, 2026 | 14 | 7 |
| Week of July 27, 2026 | 1 | 1 |
| Week of August 3, 2026 | 95 | 92 |
| Week of August 10, 2026 | 10 | 54 |
| Week of August 17, 2026 | 17 | 5 |
| Week of August 24, 2026 | 1 | 10 |
| Week of August 31, 2026 | 47 | 61 |
| Week of September 7, 2026 | 62 | 93 |
| Week of September 14, 2026 | 15 | 13 |
| Week of September 21, 2026 | 4 | 86 |
| Week of September 28, 2026 | 9 | 4 |
| Week of October 5, 2026 | 13 | 35 |
| Week of October 12, 2026 | 42 | 51 |
| Week of October 19, 2026 | 7 | 5 |
| Week of October 26, 2026 | 10 | 44 |
| Week of November 2, 2026 | 0 | 0 |
Latest disclosed trades
| Report | ||||||
|---|---|---|---|---|---|---|
| MUMicron Technology |  John J. McGuire III House · R-VA 5 | Purchase$1,001 - $15,000 · Spouse | Nov 1, 2026 | Oct 1, 2026 | ▼ 24.0%−22.5 pts vs S&P | Filing for MU on Oct 1, 2026 |
| MUMicron Technology | John J. McGuire III House · R-VA 5 | Purchase$1,001 - $15,000 · Spouse | Nov 1, 2026 | Sep 25, 2026 | ▼ 23.0%−20.5 pts vs S&P | Filing for MU on Sep 25, 2026 |
| AVGOBroadcom | John J. McGuire III House · R-VA 5 | Sale (partial)$1,001 - $15,000 · Spouse | Nov 1, 2026 | Sep 24, 2026 | ▼ 8.0%−6.1 pts vs S&P | Filing for AVGO on Sep 24, 2026 |
| MUMicron Technology | John J. McGuire III House · R-VA 5 | Purchase$1,001 - $15,000 · Spouse | Nov 1, 2026 | Sep 24, 2026 | ▼ 22.8%−20.9 pts vs S&P | Filing for MU on Sep 24, 2026 |
| JNJJohnson & Johnson |  Thomas H. Kean, Jr. House · R-NJ 7 | Sale (partial)$1,001 - $15,000 | Oct 30, 2026 | Sep 30, 2026 | ▲ 2.2%+3.6 pts vs S&P | Filing for JNJ on Sep 30, 2026 |
| SYKStryker Corporation | Thomas H. Kean, Jr. House · R-NJ 7 | Sale (partial)$1,001 - $15,000 | Oct 30, 2026 | Sep 30, 2026 | ▲ 11.4%+12.8 pts vs S&P | Filing for SYK on Sep 30, 2026 |
| ESABESAB Corp | Thomas H. Kean, Jr. House · R-NJ 7 | Purchase$1,001 - $15,000 | Oct 30, 2026 | Sep 29, 2026 | ▲ 13.1%+14.7 pts vs S&P | Filing for ESAB on Sep 29, 2026 |
| HONAHoneywell Aerospace |  Carol D. Miller House · R-WV 1 | Sale (full)$710.52 · Spouse | Oct 30, 2026 | Sep 29, 2026 | ▲ 1.6%+3.2 pts vs S&P | Filing for HONA on Sep 29, 2026 |
| MDLZMondelez International | Thomas H. Kean, Jr. House · R-NJ 7 | Sale (partial)$1,001 - $15,000 | Oct 30, 2026 | Sep 23, 2026 | ▲ 9.0%+11.1 pts vs S&P | Filing for MDLZ on Sep 23, 2026 |
| ABTAbbott Laboratories | Thomas H. Kean, Jr. House · R-NJ 7 | Sale (partial)$1,001 - $15,000 | Oct 30, 2026 | Sep 17, 2026 | ▲ 8.4%+9.6 pts vs S&P | Filing for ABT on Sep 17, 2026 |
| TXNTexas Instruments | Thomas H. Kean, Jr. House · R-NJ 7 | Purchase$1,001 - $15,000 | Oct 30, 2026 | Sep 17, 2026 | — | Filing for TXN on Sep 17, 2026 |
| TAT&T |  David J. Taylor House · R-OH 2 | Purchase$1,001 - $15,000 | Oct 29, 2026 | Oct 15, 2026 | ▼ 8.8%−6.2 pts vs S&P | Filing for T on Oct 15, 2026 |
| LRCXLam Research | David J. Taylor House · R-OH 2 | Purchase$1,001 - $15,000 | Oct 29, 2026 | Oct 15, 2026 | ▼ 18.0%−15.4 pts vs S&P | Filing for LRCX on Oct 15, 2026 |
| MPCMarathon Petroleum | David J. Taylor House · R-OH 2 | Sale (full)$1,001 - $15,000 | Oct 29, 2026 | Oct 15, 2026 | ▼ 9.8%−7.2 pts vs S&P | Filing for MPC on Oct 15, 2026 |
| MPCMarathon Petroleum | David J. Taylor House · R-OH 2 | Sale (full)$1,001 - $15,000 | Oct 29, 2026 | Oct 15, 2026 | ▼ 9.8%−7.2 pts vs S&P | Filing for MPC on Oct 15, 2026 |
| PLDPrologis | David J. Taylor House · R-OH 2 | Purchase$1,001 - $15,000 | Oct 29, 2026 | Oct 15, 2026 | ▲ 2.1%+4.7 pts vs S&P | Filing for PLD on Oct 15, 2026 |
| PLDPrologis | David J. Taylor House · R-OH 2 | Purchase$1,001 - $15,000 | Oct 29, 2026 | Oct 15, 2026 | ▲ 2.1%+4.7 pts vs S&P | Filing for PLD on Oct 15, 2026 |
| RPMRPM International Inc | David J. Taylor House · R-OH 2 | Purchase$1,001 - $15,000 | Oct 29, 2026 | Oct 15, 2026 | ▲ 8.3%+10.9 pts vs S&P | Filing for RPM on Oct 15, 2026 |
| VVisa Inc. | David J. Taylor House · R-OH 2 | Sale (full)$1,001 - $15,000 | Oct 29, 2026 | Oct 15, 2026 | ▲ 6.4%+9.0 pts vs S&P | Filing for V on Oct 15, 2026 |
| ASMLAsml Holding NV |  Kevin Hern House · R-OK 1 | Sale (partial)$15,001 - $50,000 · Joint | Oct 28, 2026 | Oct 23, 2026 | ▼ 3.9%−2.9 pts vs S&P | Filing for ASML on Oct 23, 2026 |
| STXSeagate Technology | Kevin Hern House · R-OK 1 | Sale (partial)$15,001 - $50,000 | Oct 28, 2026 | Oct 23, 2026 | ▼ 5.8%−4.8 pts vs S&P | Filing for STX on Oct 23, 2026 |
| TXNTexas Instruments | Kevin Hern House · R-OK 1 | Sale (partial)$15,001 - $50,000 · Joint | Oct 28, 2026 | Oct 14, 2026 | — | Filing for TXN on Oct 14, 2026 |
| DISThe Walt Disney Company |  Pete Sessions House · R-TX 17 | Sale (full)$1,001 - $15,000 | Oct 27, 2026 | Oct 28, 2026date after report | — | Filing for DIS on Oct 28, 2026 |
| AMZNAmazon | Pete Sessions House · R-TX 17 | Sale (full)$15,001 - $50,000 | Oct 27, 2026 | Oct 27, 2026 | ▼ 3.0%−0.7 pts vs S&P | Filing for AMZN on Oct 27, 2026 |
| MCDMcDonald's | Pete Sessions House · R-TX 17 | Sale (full)$1,001 - $15,000 · Spouse | Oct 27, 2026 | Oct 27, 2026 | ▲ 6.5%+8.8 pts vs S&P | Filing for MCD on Oct 27, 2026 |
| HDThe Home Depot | Pete Sessions House · R-TX 17 | Sale (full)$1,001 - $15,000 | Oct 27, 2026 | Oct 22, 2026 | ▲ 4.1%+5.6 pts vs S&P | Filing for HD on Oct 22, 2026 |
| LOWLowe's | Pete Sessions House · R-TX 17 | Sale (full)$15,001 - $50,000 | Oct 27, 2026 | Oct 22, 2026 | ▲ 6.7%+8.3 pts vs S&P | Filing for LOW on Oct 22, 2026 |
| PEPPepsiCo | Pete Sessions House · R-TX 17 | Sale (full)$1,001 - $15,000 | Oct 27, 2026 | Oct 21, 2026 | ▲ 4.3%+7.0 pts vs S&P | Filing for PEP on Oct 21, 2026 |
| REZIResideo Technologies, Inc. | Pete Sessions House · R-TX 17 | Sale (full)$344.99 | Oct 27, 2026 | Oct 21, 2026 | ▲ 10.1%+12.9 pts vs S&P | Filing for REZI on Oct 21, 2026 |
| SOLSSolstice Advanced Materials Inc. | Pete Sessions House · R-TX 17 | Sale (full)$1,001 - $15,000 | Oct 27, 2026 | Oct 21, 2026 | ▼ 9.3%−6.6 pts vs S&P | Filing for SOLS on Oct 21, 2026 |
| IBMIBM | Pete Sessions House · R-TX 17 | Sale (full)$1,001 - $15,000 | Oct 27, 2026 | Oct 20, 2026 | ▲ 4.4%+6.6 pts vs S&P | Filing for IBM on Oct 20, 2026 |
| BRK.BBerkshire Hathaway | Pete Sessions House · R-TX 17 | Sale (full)$15,001 - $50,000 | Oct 27, 2026 | Oct 15, 2026 | ▲ 5.8%+8.3 pts vs S&P | Filing for BRK.B on Oct 15, 2026 |
| CVXChevron Corporation | Pete Sessions House · R-TX 17 | Sale (full)$15,001 - $50,000 | Oct 27, 2026 | Oct 14, 2026 | ▲ 2.6%+4.8 pts vs S&P | Filing for CVX on Oct 14, 2026 |
| XOMExxonMobil | Pete Sessions House · R-TX 17 | Sale (full)$1,001 - $15,000 | Oct 27, 2026 | Oct 14, 2026 | ▲ 1.5%+3.8 pts vs S&P | Filing for XOM on Oct 14, 2026 |
| COSTCostco | Pete Sessions House · R-TX 17 | Sale (full)$100,001 - $250,000 | Oct 27, 2026 | Oct 13, 2026 | ▲ 9.2%+12.5 pts vs S&P | Filing for COST on Oct 13, 2026 |
| PGProcter & Gamble | Pete Sessions House · R-TX 17 | Sale (full)$1,001 - $15,000 | Oct 27, 2026 | Oct 8, 2026 | ▲ 9.3%+12.2 pts vs S&P | Filing for PG on Oct 8, 2026 |
| ABTAbbott Laboratories | Pete Sessions House · R-TX 17 | Sale (full)$50,001 - $100,000 · Spouse | Oct 27, 2026 | Oct 2, 2026 | ▲ 13.7%+16.0 pts vs S&P | Filing for ABT on Oct 2, 2026 |
| GOOGLAlphabet Inc. (Class A) | Pete Sessions House · R-TX 17 | Sale (full)$100,001 - $250,000 · Spouse | Oct 27, 2026 | Oct 2, 2026 | ▼ 18.8%−16.5 pts vs S&P | Filing for GOOGL on Oct 2, 2026 |
| AMZNAmazon | Pete Sessions House · R-TX 17 | Sale (full)$100,001 - $250,000 · Spouse | Oct 27, 2026 | Oct 2, 2026 | ▼ 2.3%−0.1 pts vs S&P | Filing for AMZN on Oct 2, 2026 |
| AAPLApple Inc. | Pete Sessions House · R-TX 17 | Sale (full)$250,001 - $500,000 · Spouse | Oct 27, 2026 | Oct 2, 2026 | ▲ 1.4%+3.7 pts vs S&P | Filing for AAPL on Oct 2, 2026 |
Most bought and sold
Most bought, last 30 days
- PLD Prologis 1 member buying · 2 purchases · $2,002–$30,000
- RPM RPM International Inc 1 member buying · 2 purchases · $2,002–$30,000
- T AT&T 1 member buying · 2 purchases · $2,002–$30,000
- ADI Analog Devices 1 member buying · 1 purchase · $1,001–$15,000
- FITB Fifth Third Bancorp 1 member buying · 1 purchase · $1,001–$15,000
- LRCX Lam Research 1 member buying · 1 purchase · $1,001–$15,000
- TSM Taiwan Semiconductor Manufacturing Co LTD 1 member buying · 1 purchase · $1,001–$15,000
- WSM Williams-Sonoma, Inc. 1 member buying · 1 purchase · $1,001–$15,000
Most sold, last 30 days
- HD The Home Depot 2 members selling · 2 sales · $2,002–$30,000
- PG Procter & Gamble 2 members selling · 2 sales · $2,002–$30,000
- MPC Marathon Petroleum 1 member selling · 2 sales · $2,002–$30,000
- COST Costco 1 member selling · 1 sale · $100,001–$250,000
- GOOGL Alphabet Inc. (Class A) 1 member selling · 1 sale · $50,001–$100,000
- AMZN Amazon 1 member selling · 1 sale · $15,001–$50,000
- ASML Asml Holding NV 1 member selling · 1 sale · $15,001–$50,000
- BRK.B Berkshire Hathaway 1 member selling · 1 sale · $15,001–$50,000
- CVX Chevron Corporation 1 member selling · 1 sale · $15,001–$50,000
- LOW Lowe's 1 member selling · 1 sale · $15,001–$50,000
Most bought, last 90 days
- MSFT Microsoft Corporation 4 members buying (7selling) · 6 purchases · $768,006–$1.6M
- TSM Taiwan Semiconductor Manufacturing Co LTD 3 members buying · 3 purchases · $3,003–$45,000
- NVDA NVIDIA Corporation 2 members buying (3selling) · 4 purchases · $4,004–$60,000
- SNOW Snowflake Inc. 2 members buying (1selling) · 3 purchases · $17,003–$80,000
- AAPL Apple Inc. 2 members buying (4selling) · 3 purchases · $3,003–$45,000
- AVGO Broadcom 2 members buying (2selling) · 3 purchases · $3,003–$45,000
- GOOGL Alphabet Inc. (Class A) 2 members buying (4selling) · 3 purchases · $3,003–$45,000
- HD The Home Depot 2 members buying (3selling) · 3 purchases · $3,003–$45,000
- NFLX Netflix 2 members buying · 3 purchases · $3,003–$45,000
- PG Procter & Gamble 2 members buying (3selling) · 3 purchases · $3,003–$45,000
Most sold, last 90 days
- MSFT Microsoft Corporation 7 members selling (4buying) · 9 sales · $1M–$2.2M
- GOOGL Alphabet Inc. (Class A) 4 members selling (2buying) · 7 sales · $218,007–$545,000
- AAPL Apple Inc. 4 members selling (2buying) · 6 sales · $354,006–$810,000
- HD The Home Depot 3 members selling (2buying) · 10 sales · $115,010–$375,000
- PG Procter & Gamble 3 members selling (2buying) · 4 sales · $53,004–$145,000
- WMT Walmart 3 members selling (1buying) · 3 sales · $101,003–$215,000
- HON Honeywell Technologies 3 members selling · 3 sales · $17,003–$80,000
- NVDA NVIDIA Corporation 3 members selling (2buying) · 3 sales · $17,003–$80,000
- HONA Honeywell Aerospace 3 members selling · 3 sales · $16,713–$65,711
- SOLS Solstice Advanced Materials Inc. 3 members selling · 3 sales · $3,003–$45,000
Most active members, last 12 months
-
 Gilbert Ray Cisneros, Jr. D-CA 31 · House · 1093 trades, 2347 in stocks we cover
-
 April McClain Delaney D-MD 6 · House · 344 trades, 474 in stocks we cover
- David J. Taylor R-OH 2 · House · 185 trades, 243 in stocks we cover
- Kevin Hern R-OK 1 · House · 172 trades, 721 in stocks we cover
-
 Julie Johnson D-TX 32 · House · 136 trades, 570 in stocks we cover
-
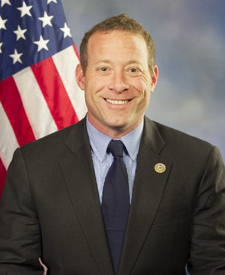 Josh Gottheimer D-NJ 5 · House · 132 trades, 2922 in stocks we cover
-
 Maria Elvira Salazar R-FL 27 · House · 121 trades, 123 in stocks we cover
-
 Jared Moskowitz D-FL 23 · House · 84 trades, 459 in stocks we cover
-
 Richard McCormick R-GA 7 · House · 83 trades, 111 in stocks we cover
- Thomas H. Kean, Jr. R-NJ 7 · House · 68 trades, 176 in stocks we cover
-
 Cleo Fields D-LA 6 · House · 59 trades, 235 in stocks we cover
-
 Jonathan L. Jackson D-IL 1 · House · 55 trades, 185 in stocks we cover
By party, last 12 months
| Party | Members | Purchases | Sales | Share purchases |
|---|---|---|---|---|
| Democrat | 29 | 1,051 | 1,003 | 51% |
| Republican | 42 | 424 | 652 | 39% |
By sector, last 12 months
| Sector | Members | Purchases | Sales | Share purchases |
|---|---|---|---|---|
| Technology | 43 | 337 | 372 | 48% |
| Industrials | 38 | 246 | 251 | 49% |
| Financials | 37 | 163 | 217 | 43% |
| Health Care | 30 | 173 | 188 | 48% |
| Consumer Discretionary | 31 | 164 | 179 | 48% |
| Communication Services | 32 | 89 | 97 | 48% |
| Consumer Staples | 25 | 69 | 97 | 42% |
| Energy | 21 | 44 | 72 | 38% |
| Materials | 16 | 57 | 33 | 63% |
| Real Estate | 15 | 44 | 44 | 50% |
| Utilities | 12 | 18 | 24 | 43% |
What happened to the stocks afterwards
| After | Window | Average excess | Typical (median) | Beat the S&P 500 | Trades | From the filing date |
|---|---|---|---|---|---|---|
| Purchases | 30 days | 0.0% | −0.2% | 49% | 15,401 | +0.1% (15,472) |
| Purchases | 90 days | +0.2% | −0.8% | 47% | 15,254 | +0.1% (15,254) |
| Sales | 30 days | +0.3% | 0.0% | 50% | 15,915 | +0.2% (15,895) |
| Sales | 90 days | +0.8% | −0.7% | 48% | 15,587 | +0.2% (15,534) |
Would copying Congress have paid?
Suppose you had copied every House member’s disclosed holdings: starting from the holdings in each annual disclosure report once it was published, then buying and selling as each trade report became public, sized by the amounts reported (call options counted as the stock until they expire). Positions are sized in dollars, so members with large portfolios carry most of the weight. $10,000 put in on January 5, 2015 would have grown to $57,644 by November 2, 2026, against $45,514 in the S&P 500. That is +16.0% a year against +13.7%, with much the same ups and downs as the market (beta 1.10). Trade by trade the picture is weaker: six months after the report, the average purchase was −0.5% against the S&P 500, the typical (median) one −1.6%, and 46% beat the index.
- Return a year, copying
- +16.0%
- S&P 500, same dates
- +13.7%
- Sharpe ratio (S&P 500)
- 0.74 (0.70)
- Biggest drop (S&P 500)
- −36% (−34%)
The member’s timing or the follower’s?
| Purchases, held | From the trade date | From the report | Beat the S&P 500 | Purchases counted | Evidence |
|---|---|---|---|---|---|
| 1 month | −0.1% | 0.0% | 48% | 17,137 | No reliable evidence |
| 3 months | +0.1% | 0.0% | 48% | 16,888 | No reliable evidence |
| 6 months | −0.3% | −0.5% | 46% | 16,563 | No reliable evidence |
| 12 months | +0.3% | 0.0% | 45% | 15,374 | No reliable evidence |
By party and chamber
| Group | Purchases | 6 months after report | After trade date | Beat the S&P 500 | Copying, a year | S&P 500, a year | Sharpe |
|---|---|---|---|---|---|---|---|
| Democrats | 9,048 | −0.7% | −0.3% | 46% | +17.7% | +13.8% | 0.75 |
| Republicans | 5,707 | −0.4% | −0.1% | 45% | +12.5% | +13.6% | 0.62 |
| House | 17,208 | −0.5% | −0.3% | 46% | +16.0% | +13.7% | 0.74 |
Member by member
| Mark E. GreenHouse · TN | R | 232162 purchases counted | +12.1% | +8.6% | 56% | Strong evidence: ahead | 0.56 |
| Donald S. Beyer, Jr.House · VA | D | 526300 purchases counted | +9.3% | +9.7% | 58% | No reliable evidence | 0.75 |
| Alan S. LowenthalHouse · CA | D | 630275 purchases counted | +7.6% | +10.0% | 60% | Some evidence: ahead | 0.58 |
| Tim MooreHouse · NC | R | 167113 purchases counted | +7.6% | +7.6% | 73% | No reliable evidence | 1.02 |
| John R. CurtisHouse · UT | R | 271118 purchases counted | +5.9% | +4.1% | 52% | Strong evidence: ahead | 0.59 |
| Julie JohnsonHouse · TX | D | 55472 purchases counted | +5.7% | +1.5% | 57% | No reliable evidence | 1.05 |
| Suzan K. DelBeneHouse · WA | D | 9548 purchases counted | +5.6% | +6.3% | 71% | Strong evidence: ahead | 0.55 |
| Dwight EvansHouse · PA | D | 13169 purchases counted | +5.3% | +5.0% | 59% | Some evidence: ahead | 0.93 |
| Nancy PelosiHouse · CA | D | 8644 purchases counted | +5.3% | +7.0% | 66% | Some evidence: ahead | 0.72 |
| Ken BuckHouse · CO | R | 4322 purchases counted | +5.1% | +3.4% | 64% | Not enough data | 0.02 |
| Bradley Scott SchneiderHouse · IL | D | 11040 purchases counted | +4.9% | +4.1% | 60% | Some evidence: ahead | 0.74 |
| Roger MarshallHouse · KS | R | 8846 purchases counted | +4.9% | +2.8% | 57% | No reliable evidence | 0.55 |
| Barbara J Honorable ComstockHouse · VA | I | 4635 purchases counted | +4.3% | +6.5% | 77% | No reliable evidence | 0.90 |
| James ComerHouse · KY | R | 4429 purchases counted | +4.3% | +3.3% | 48% | Not enough data | 0.66 |
| Cynthia AxneHouse · IA | D | 175109 purchases counted | +4.3% | +3.4% | 63% | Strong evidence: ahead | 0.39 |
| Kathy CastorHouse · FL | D | 6645 purchases counted | +3.4% | +2.5% | 60% | No reliable evidence | 0.54 |
| Michael GuestHouse · MS | R | 5443 purchases counted | +2.7% | −0.2% | 42% | No reliable evidence | 0.32 |
| Lisa C. McClainHouse · MI | R | 1304653 purchases counted | +2.5% | +0.1% | 46% | Not enough data | 0.03 |
| Mo BrooksHouse · AL | R | 8947 purchases counted | +2.1% | +3.2% | 47% | No reliable evidence | 0.60 |
| Marjorie Taylor GreeneHouse · GA | R | 482469 purchases counted | +2.1% | +2.0% | 48% | No reliable evidence | 0.68 |
| Debbie Wasserman SchultzHouse · FL | D | 6038 purchases counted | +2.0% | +5.0% | 47% | No reliable evidence | 0.54 |
| Carlos Mr CurbeloHouse · FL | I | 3823 purchases counted | +1.7% | +3.8% | 70% | Not enough data | 0.56 |
| Brian J. MastHouse · FL | R | 6132 purchases counted | +1.7% | +1.0% | 44% | No reliable evidence | 0.14 |
| Ritchie TorresHouse · NY | D | 12261 purchases counted | +1.4% | −0.4% | 46% | Not enough data | 0.65 |
| Greg GianforteHouse · MT | I | 478225 purchases counted | +1.4% | +0.5% | 50% | No reliable evidence | 0.40 |
| Joe CourtneyHouse · CT | D | 7937 purchases counted | +1.4% | −2.8% | 54% | Not enough data | 0.62 |
| Josh GottheimerHouse · NJ | D | 26761073 purchases counted | +1.4% | +2.1% | 50% | No reliable evidence | 0.57 |
| Jared MoskowitzHouse · FL | D | 454278 purchases counted | +1.3% | +0.6% | 46% | No reliable evidence | 0.79 |
| Susan A. DavisHouse · CA | I | 5027 purchases counted | +1.2% | +2.8% | 48% | No reliable evidence | 0.47 |
| John H. RutherfordHouse · FL | R | 19998 purchases counted | +1.2% | +1.1% | 46% | No reliable evidence | 0.17 |
| K. Michael ConawayHouse · TX | I | 627247 purchases counted | +1.1% | +0.8% | 49% | No reliable evidence | 0.73 |
| Bob GibbsHouse · OH | R | 13587 purchases counted | +0.9% | +0.8% | 44% | No reliable evidence | 0.75 |
| Pete SessionsHouse · TX | R | 321177 purchases counted | +0.8% | +2.2% | 53% | Some evidence: ahead | 0.87 |
| Dan NewhouseHouse · WA | R | 19287 purchases counted | +0.7% | −0.3% | 53% | Not enough data | 0.88 |
| Thomas MacArthurHouse · NJ | I | 1228622 purchases counted | +0.6% | +0.7% | 51% | No reliable evidence | 0.67 |
| Val T. HoyleHouse · OR | D | 369183 purchases counted | +0.4% | −0.3% | 44% | Not enough data | 0.32 |
| Thomas H. Kean, Jr.House · NJ | R | 14152 purchases counted | +0.4% | +3.0% | 42% | No reliable evidence | 0.57 |
| Lamar SmithHouse · TX | I | 348181 purchases counted | +0.4% | +1.2% | 46% | Some evidence: ahead | 0.66 |
| Greg StantonHouse · AZ | D | 18591 purchases counted | +0.3% | +0.1% | 45% | Not enough data | 0.91 |
| Cleo FieldsHouse · LA | D | 234205 purchases counted | +0.1% | +1.8% | 47% | No reliable evidence | 0.70 |
| David B. McKinleyHouse · WV | R | 384215 purchases counted | +0.1% | −0.6% | 57% | No reliable evidence | 0.66 |
| Thomas J. RooneyHouse · FL | I | 490352 purchases counted | −0.1% | −0.6% | 60% | No reliable evidence | 0.80 |
| Richard McCormickHouse · GA | R | 11159 purchases counted | −0.1% | −3.4% | 47% | Not enough data | 1.80 |
| Van TaylorHouse · TX | R | 26431 purchases counted | −0.1% | −0.1% | 61% | Not enough data | 0.75 |
| Gilbert Ray Cisneros, Jr.House · CA | D | 23311122 purchases counted | −0.2% | −0.6% | 44% | No reliable evidence | 0.74 |
| Ed WhitfieldHouse · KY | I | 7453 purchases counted | −0.2% | −0.8% | 43% | No reliable evidence | 0.49 |
| David E. PriceHouse · NC | D | 5143 purchases counted | −0.4% | −0.7% | 47% | No reliable evidence | 0.55 |
| Raúl M. GrijalvaHouse · AZ | D | 7529 purchases counted | −0.5% | +1.4% | 52% | No reliable evidence | 0.07 |
| Greg LandsmanHouse · OH | D | 16454 purchases counted | −0.6% | +8.1% | 50% | Some evidence: behind | 0.02 |
| Robert J. WittmanHouse · VA | R | 185106 purchases counted | −0.6% | −2.5% | 52% | No reliable evidence | 0.68 |
| Kevin HernHouse · OK | R | 691455 purchases counted | −0.7% | −0.8% | 47% | No reliable evidence | 0.49 |
| Peter WelchHouse · VT | D | 6923 purchases counted | −0.8% | +1.8% | 48% | No reliable evidence | 0.72 |
| Rubén HinojosaHouse · TX | I | 8139 purchases counted | −1.3% | −3.7% | 28% | No reliable evidence | 0.45 |
| Kathy E. ManningHouse · NC | D | 722416 purchases counted | −1.3% | −1.3% | 49% | No reliable evidence | 0.62 |
| Jefferson ShreveHouse · IN | R | 546190 purchases counted | −1.3% | −1.8% | 34% | Not enough data | 0.35 |
| John A. YarmuthHouse · KY | D | 303145 purchases counted | −1.4% | −2.3% | 48% | No reliable evidence | 0.59 |
| William R. KeatingHouse · MA | D | 10273 purchases counted | −1.4% | −0.6% | 47% | No reliable evidence | 0.00 |
| David A. TrottHouse · MI | I | 6021 purchases counted | −1.6% | −2.4% | 43% | No reliable evidence | 0.37 |
| Debbie DingellHouse · MI | D | 163101 purchases counted | −1.7% | −1.4% | 48% | No reliable evidence | 0.72 |
| Susie LeeHouse · NV | D | 1015500 purchases counted | −1.8% | −2.8% | 45% | No reliable evidence | 0.05 |
| Scott H. PetersHouse · CA | D | 301177 purchases counted | −1.8% | −1.4% | 51% | Not enough data | -0.02 |
| Earl BlumenauerHouse · OR | D | 320217 purchases counted | −1.8% | −1.8% | 40% | No reliable evidence | 0.46 |
| James R. LangevinHouse · RI | D | 196106 purchases counted | −1.8% | −3.7% | 40% | No reliable evidence | 0.47 |
| Lois FrankelHouse · FL | D | 1105516 purchases counted | −2.0% | −2.6% | 44% | Some evidence: behind | 0.54 |
| Zoe LofgrenHouse · CA | D | 335163 purchases counted | −2.0% | −1.4% | 44% | No reliable evidence | 0.78 |
| Gerald E. ConnollyHouse · VA | D | 6621 purchases counted | −2.1% | −1.9% | 43% | No reliable evidence | 0.45 |
| Bill FloresHouse · TX | I | 588192 purchases counted | −2.1% | −1.8% | 48% | No reliable evidence | 0.43 |
| Julia LetlowHouse · LA | R | 220134 purchases counted | −2.1% | −1.5% | 38% | Not enough data | 0.91 |
| E. Scott RigellHouse · VA | I | 5139 purchases counted | −2.2% | −1.8% | 36% | No reliable evidence | 0.66 |
| Bruce WestermanHouse · AR | R | 15475 purchases counted | −2.2% | −1.6% | 32% | Not enough data | 1.50 |
| John JamesHouse · MI | R | 248117 purchases counted | −2.2% | +1.6% | 44% | Not enough data | 0.88 |
| Virginia FoxxHouse · NC | R | 644510 purchases counted | −2.4% | −1.5% | 45% | Some evidence: behind | 0.40 |
| Victoria SpartzHouse · IN | R | 2521 purchases counted | −2.4% | +1.2% | 38% | No reliable evidence | 0.66 |
| Lloyd DoggettHouse · TX | D | 228216 purchases counted | −2.6% | −2.3% | 38% | Strong evidence: behind | 0.51 |
| Thomas R. SuozziHouse · NY | D | 521265 purchases counted | −2.9% | −0.2% | 45% | No reliable evidence | 0.20 |
| Donna ShalalaHouse · FL | I | 33394 purchases counted | −3.2% | −6.3% | 39% | Not enough data | 0.59 |
| Katherine M. ClarkHouse · MA | D | 360170 purchases counted | −3.4% | −1.4% | 48% | No reliable evidence | 0.66 |
| Rick LarsenHouse · WA | D | 8339 purchases counted | −3.4% | −3.5% | 49% | Strong evidence: behind | 0.80 |
| Daniel MeuserHouse · PA | R | 6826 purchases counted | −3.5% | −3.2% | 27% | Not enough data | 1.09 |
| Scott FranklinHouse · FL | R | 19587 purchases counted | −3.9% | −5.6% | 37% | No reliable evidence | 0.11 |
| Dean PhillipsHouse · MN | D | 714364 purchases counted | −4.0% | −1.4% | 36% | No reliable evidence | 0.58 |
| Richard L. HannaHouse · NY | I | 12172 purchases counted | −4.3% | −1.2% | 36% | No reliable evidence | 0.61 |
| David J. TaylorHouse · OH | R | 23991 purchases counted | −4.4% | −1.2% | 43% | Some evidence: behind | 1.87 |
| Byron DonaldsHouse · FL | R | 17176 purchases counted | −4.5% | +1.0% | 26% | No reliable evidence | 0.48 |
| Gary J. PalmerHouse · AL | R | 208152 purchases counted | −4.6% | −1.1% | 35% | Not enough data | 0.24 |
| Blake D. MooreHouse · UT | R | 10369 purchases counted | −4.6% | −1.7% | 54% | No reliable evidence | 0.68 |
| Carlos CurbeloHouse · FL | I | 185115 purchases counted | −4.7% | −5.2% | 38% | Strong evidence: behind | 0.52 |
| Jonathan L. JacksonHouse · IL | D | 18596 purchases counted | −4.9% | −7.9% | 39% | Strong evidence: behind | 0.94 |
| Robert P. Bresnahan, Jr.House · PA | R | 587243 purchases counted | −5.3% | −3.0% | 34% | Strong evidence: behind | 0.58 |
| Rick W. AllenHouse · GA | R | 218107 purchases counted | −5.5% | −0.2% | 37% | No reliable evidence | 0.63 |
| Robert E. LattaHouse · OH | R | 2321 purchases counted | −6.0% | −3.2% | 38% | No reliable evidence | 0.44 |
| Maria Elvira SalazarHouse · FL | R | 11730 purchases counted | −6.2% | −1.0% | 33% | Not enough data | 0.55 |
| Austin ScottHouse · GA | R | 8635 purchases counted | −6.2% | +10.3% | 17% | No reliable evidence | 0.27 |
| Michael C. BurgessHouse · TX | R | 12743 purchases counted | −6.7% | −8.7% | 35% | Strong evidence: behind | 0.41 |
| Daniel S. GoldmanHouse · NY | D | 632202 purchases counted | −6.9% | −7.1% | 32% | Not enough data | 0.53 |
| Ed PerlmutterHouse · CO | D | 8742 purchases counted | −7.3% | −4.8% | 45% | Some evidence: behind | 0.35 |
| Chris JacobsHouse · NY | R | 16770 purchases counted | −7.3% | −1.7% | 40% | Strong evidence: behind | 0.14 |
| Carol D. MillerHouse · WV | R | 9553 purchases counted | −7.6% | −8.4% | 28% | Strong evidence: behind | 0.66 |
| Mikie SherrillHouse · NJ | D | 19425 purchases counted | −8.7% | −5.2% | 32% | Not enough data | 0.47 |
| Marie NewmanHouse · IL | D | 232120 purchases counted | −9.9% | −11.9% | 37% | Some evidence: behind | 0.20 |
| Jim BanksHouse · IN | R | 4425 purchases counted | −11.7% | −11.4% | 36% | No reliable evidence | 0.44 |
| Pat FallonHouse · TX | R | 17354 purchases counted | −12.9% | −10.6% | 37% | Some evidence: behind | -0.18 |
| April McClain DelaneyHouse · MD | D | 472135 purchases counted | −14.7% | −13.4% | 19% | Strong evidence: behind | 0.01 |
| Tom MalinowskiHouse · NJ | D | 248128 purchases counted | −18.1% | −7.7% | 23% | Not enough data | 0.42 |
Does a Congress long-short strategy beat the market?
A published design (following Quiver Quantitative's description) buys the stocks members reported buying and bets against those they reported selling, sized by the amounts reported, 130% long and 30% short, rebalanced weekly. We tested it on House reports, keeping a trade for 30, 90 or 365 days after it was reported. Choosing on 2015–2019, the 90-day version looked best (Sharpe ratio 0.92 against 0.78 for the S&P 500). From April 2020 it returned +17.9% a year with a Sharpe ratio of 0.63, against +19.0% and 0.93 for simply holding the S&P 500, so it did not beat the market once risk is allowed for. Its beta of 1.26 shows most of its return is market exposure; with equal money long and short, the bought-versus-sold gap had a Sharpe ratio of 0.00.
| Trade kept for | 2015–2019 (choosing) | April 2020 onwards (judging) | Market-neutral Sharpe, from 2020 | ||||
|---|---|---|---|---|---|---|---|
| A year | Sharpe | A year | Sharpe | Worst fall | Beta | ||
| 30 days | +8.1% | 0.46 | +23.0% | 0.77 | −29.2% | 1.18 | 0.18 |
| 90 days (chosen) | +16.0% | 0.92 | +17.9% | 0.63 | −39.3% | 1.26 | 0.00 |
| 365 days | +12.9% | 0.80 | +21.1% | 0.82 | −36.0% | 1.22 | -0.08 |
| S&P 500, buy and hold | +11.3% | 0.78 | +19.0% | 0.93 | −24.5% | 1.00 | |
Does it matter how many are buying?
Each month from April 30, 2015 to October 30, 2026 (138 months), we counted how many House members were net buyers or net sellers of each company over the previous 91 days, using only reports dated before the month end, and held those companies for a month. In a month with fewer than 3 such companies a row holds cash at the Treasury bill rate, so every row covers the same months. Companies with 2 or more House members buying returned +12.3% a year, against +8.7% for those with 3 or more selling, +9.0% for every covered company on the same rules and +13.7% for the S&P 500. The typical company held with 2 or more House members buying was worth about $116bn, and with 3 or more selling about $189bn, against $2.3bn for the typical covered company. Against all covered companies in the months it held shares, 2 or more buying was +2.7% a year (t = 0.90); against companies of similar market value it was −0.5% (t = −0.23). The data are House members' electronic trade reports only: Senate reports and reports filed on paper are not included. Some rows hold only a handful of companies at a time, so their results are noisy.
| Companies with… | Months invested | Held (average) | Return a year | Against all companies | Evidence | Against similar-size companies | Sharpe | Beta | Biggest drop |
|---|---|---|---|---|---|---|---|---|---|
| 1 or more House members net buying | 138 of 138 | 117 | +11.4% | +1.9% | No reliable evidence t = 1.05 | +0.1% t = 0.06 | 0.61 | 1.04 | -26.5% |
| 2 or more net buying | 138 of 138 | 26 | +12.3% | +2.7% | No reliable evidence t = 0.90 | −0.5% t = −0.23 | 0.65 | 0.98 | -24.6% |
| 3 or more net buying | 122 of 138 | 8 | +16.9% | +10.0% | Some evidence t = 1.75 | +2.4% t = 0.54 | 0.81 | 0.97 | -25.7% |
| 1 or more House members net selling | 138 of 138 | 137 | +11.3% | +1.9% | No reliable evidence t = 1.18 | +0.3% t = 0.30 | 0.58 | 1.08 | -28.8% |
| 2 or more net selling | 138 of 138 | 31 | +13.1% | +3.3% | No reliable evidence t = 1.27 | +1.6% t = 0.91 | 0.71 | 0.99 | -28.5% |
| 3 or more net selling | 115 of 138 | 12 | +8.7% | −1.1% | No reliable evidence t = −0.22 | −3.4% t = −0.80 | 0.44 | 0.93 | -35.4% |
| All companies, equal weight | 138 of 138 | +9.0% | 0.45 | 1.07 | -29.8% | ||||
| S&P 500, buy and hold | 138 of 138 | +13.7% | 0.79 | 1.00 | -23.9% |